Digital Experience Analytics
Turn digital experience into revenue-driving insights with crystal-clear visibility into user behaviour, friction, and errors.
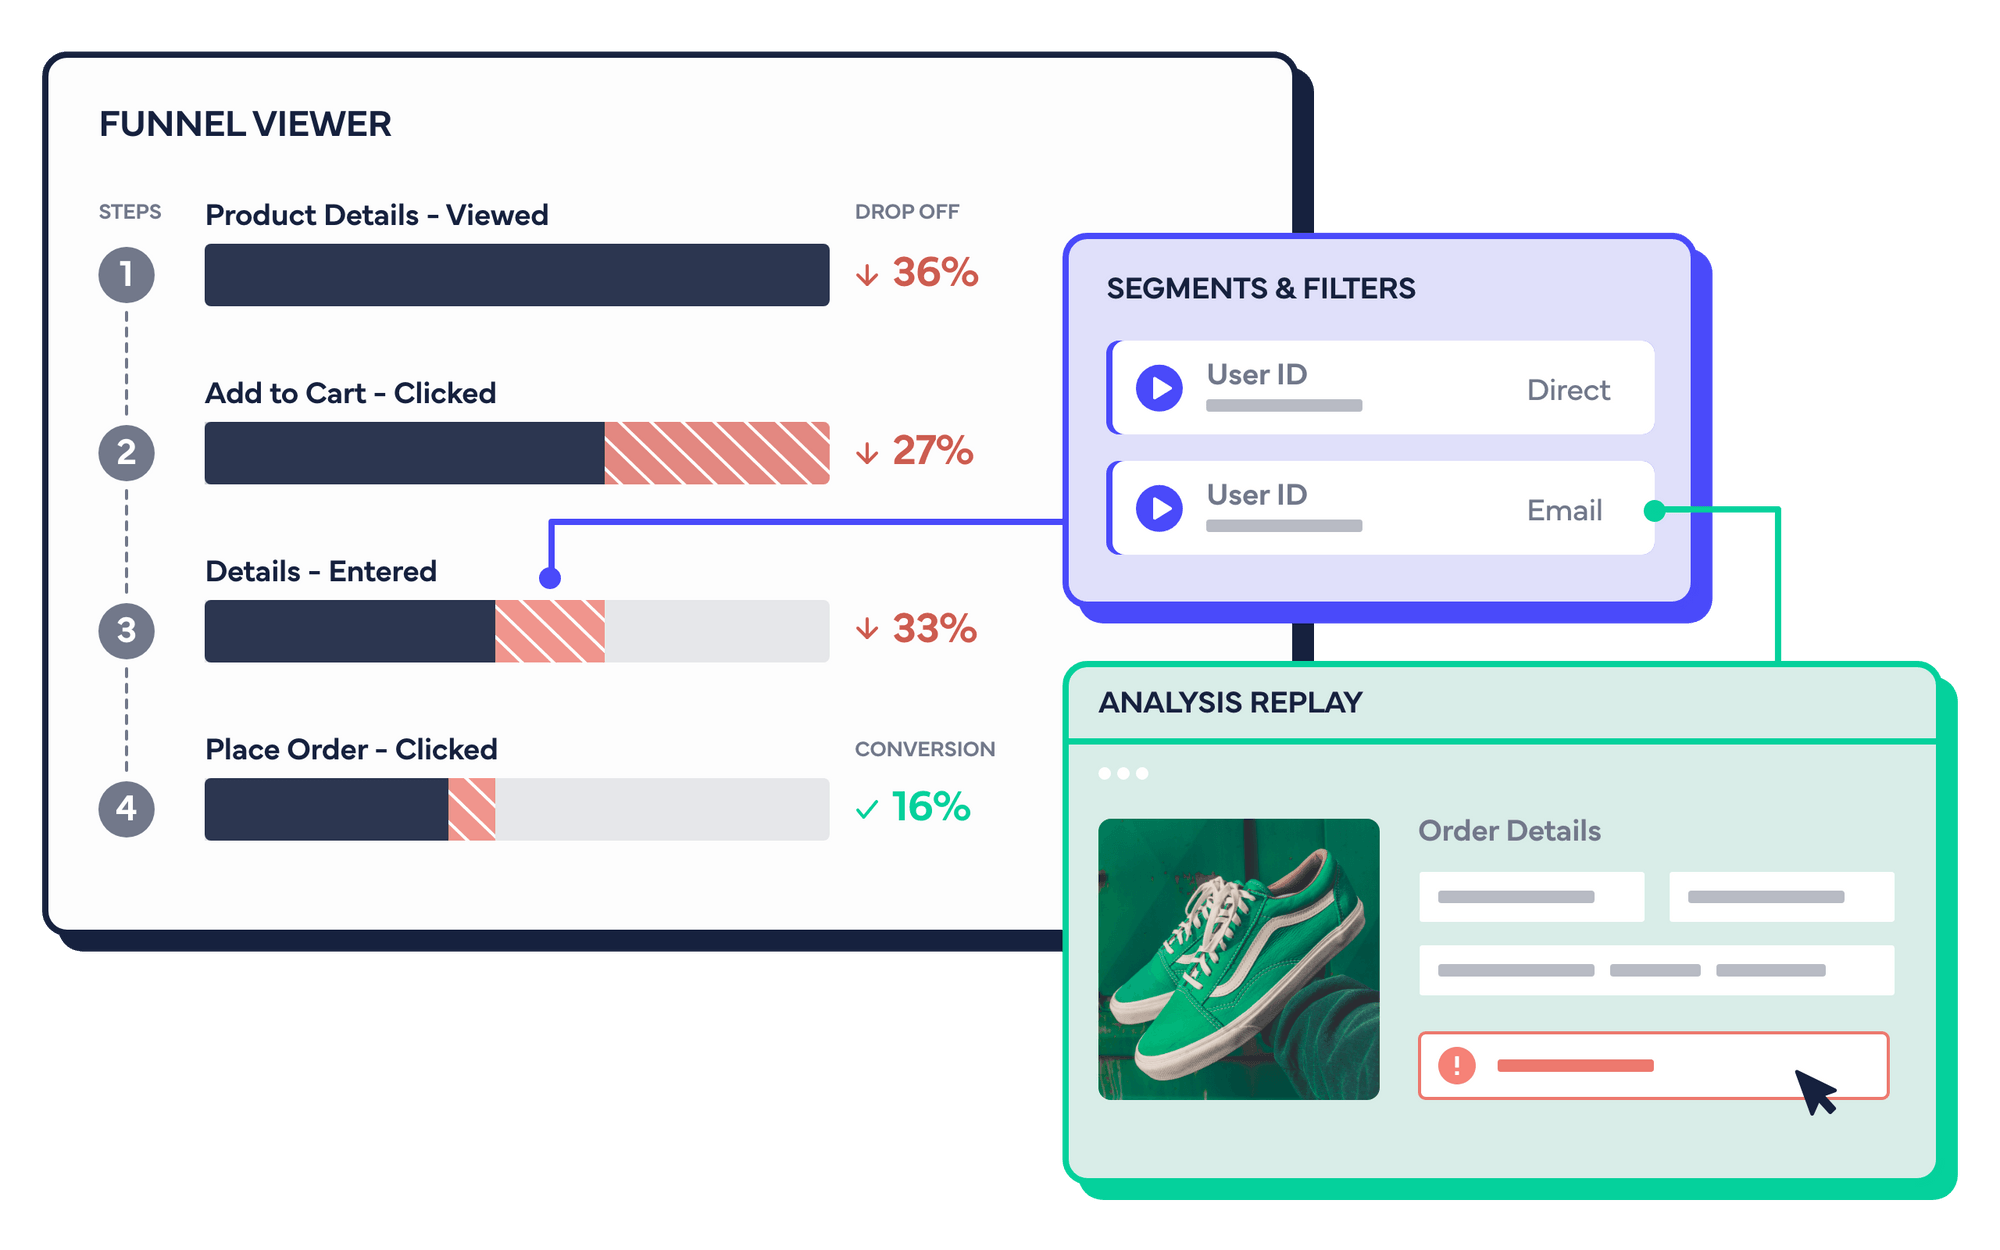
Key Benefits
Grow your business with clear, actionable insights
Prevent Revenue Loss
Surface friction, errors, and drop-offs across your funnel and quantify their business impact
Optimise Experiences
See exactly how customers experience your site and turn insights into continuous growth
Democratise Insights
Make data part of every team's workflow with intuitive, point-and-click analysis
Complete Experience Analytics Platform
Everything you need to understand and optimise your digital experience
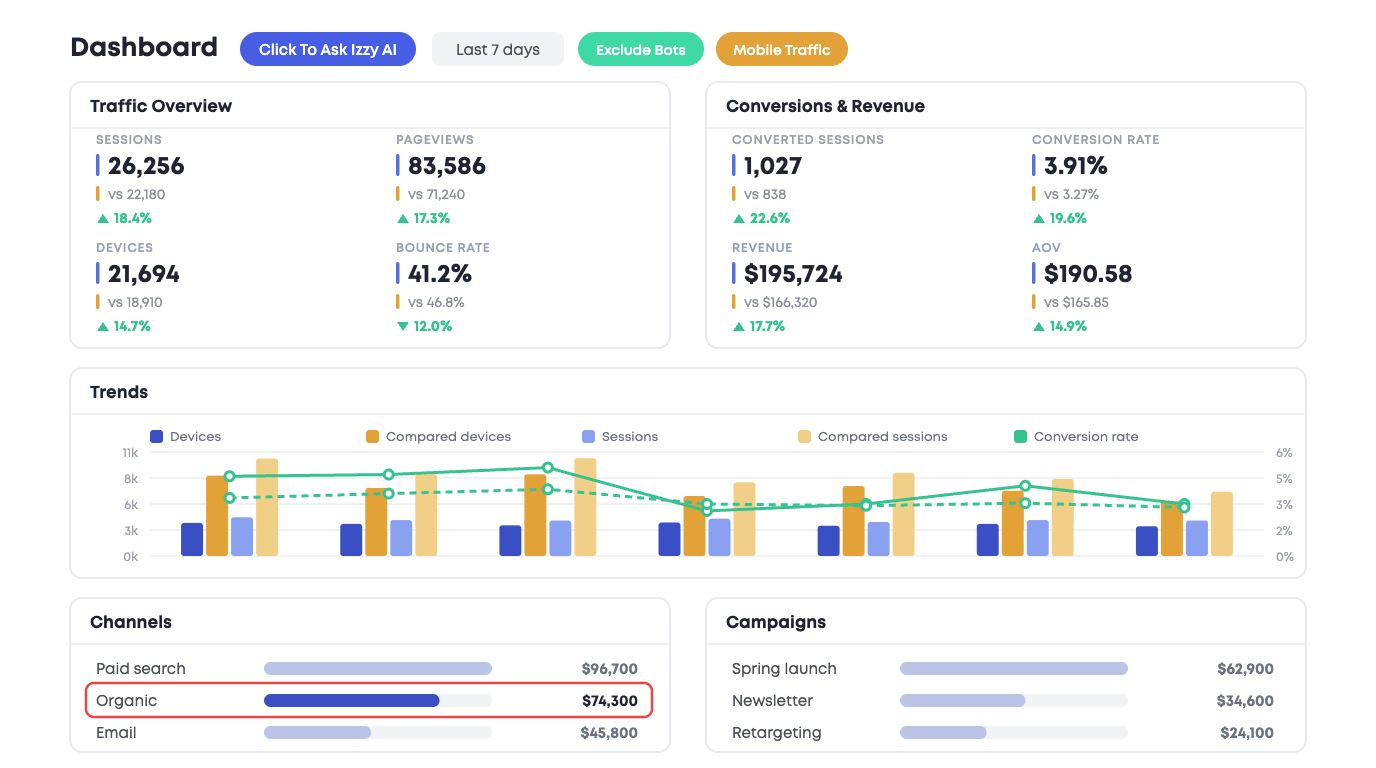
Interactive Dashboard
Understand overall trends, analyse marketing performance, and compare segments and date ranges at a glance.
- Track traffic conversions and revenue trends
- Compare segments and date ranges
- AI surfaces insights and recommends actions
Heatmaps & Clickmaps
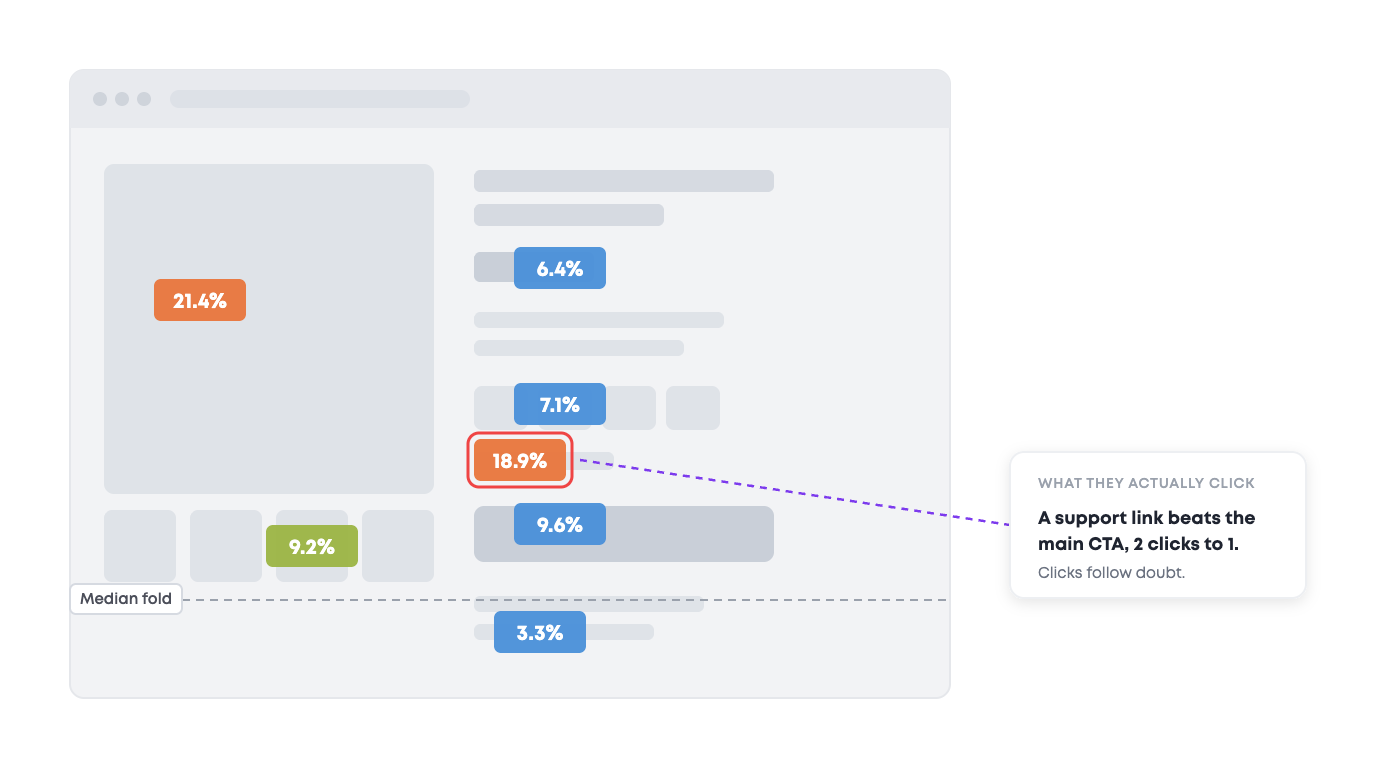
Understand clicks, hovers, scrolling and interactions — and see which behaviours actually drive conversions and revenue.
- Clickmaps and scroll heatmaps with revenue data
- Chrome extension for live page analysis
- See which interactions lead to conversions
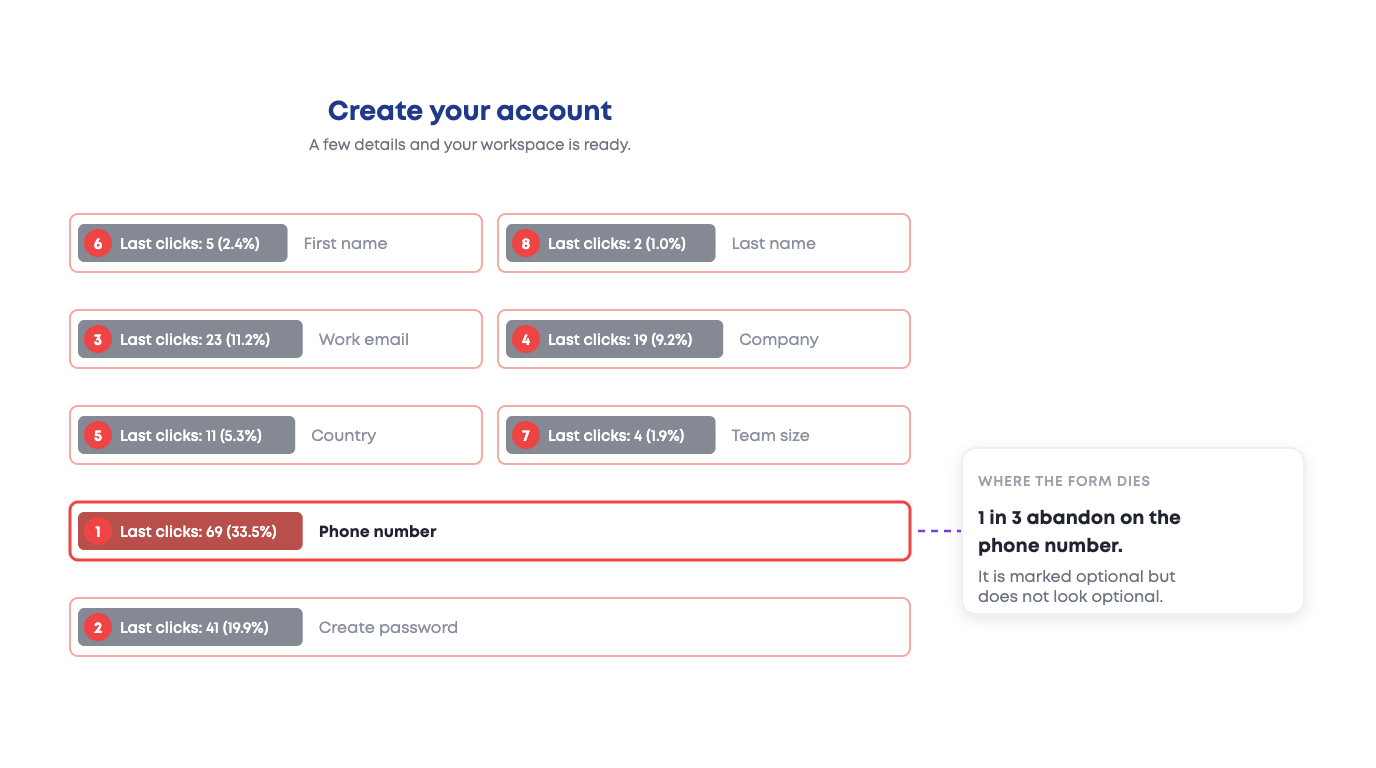
Visual Form Analysis
See exactly which form fields cause drop-offs with visual overlays — then click to create segments and watch session replays to understand why.
- Visual drop-off indicators on each form field
- Point-and-click to segment and watch replays
- Understand friction without digging through data
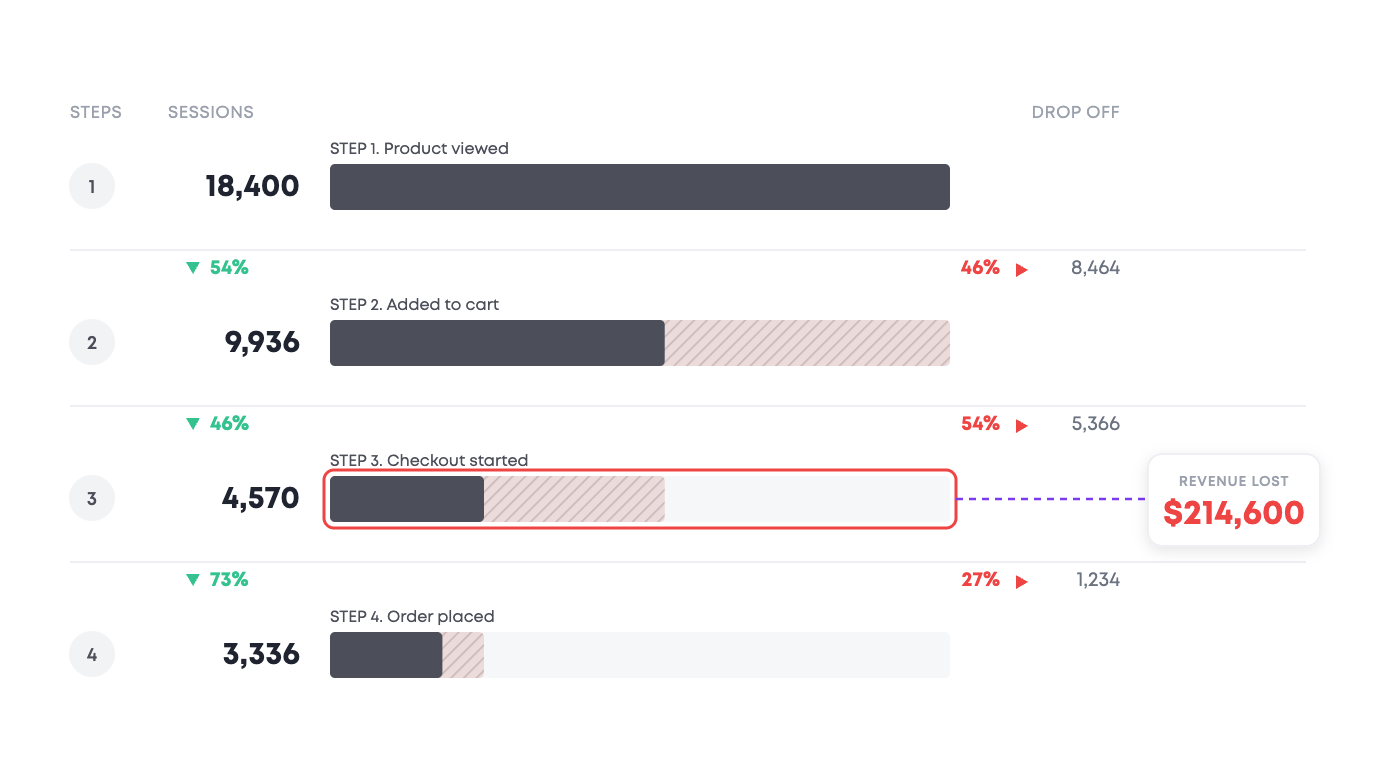
Funnel Analytics
Track user journeys through conversion funnels, identify where users drop off, and quantify the revenue impact of each step.
- Build custom funnels for any user journey
- Follow drop-off cohorts and watch replays
- Understand root causes of abandonment
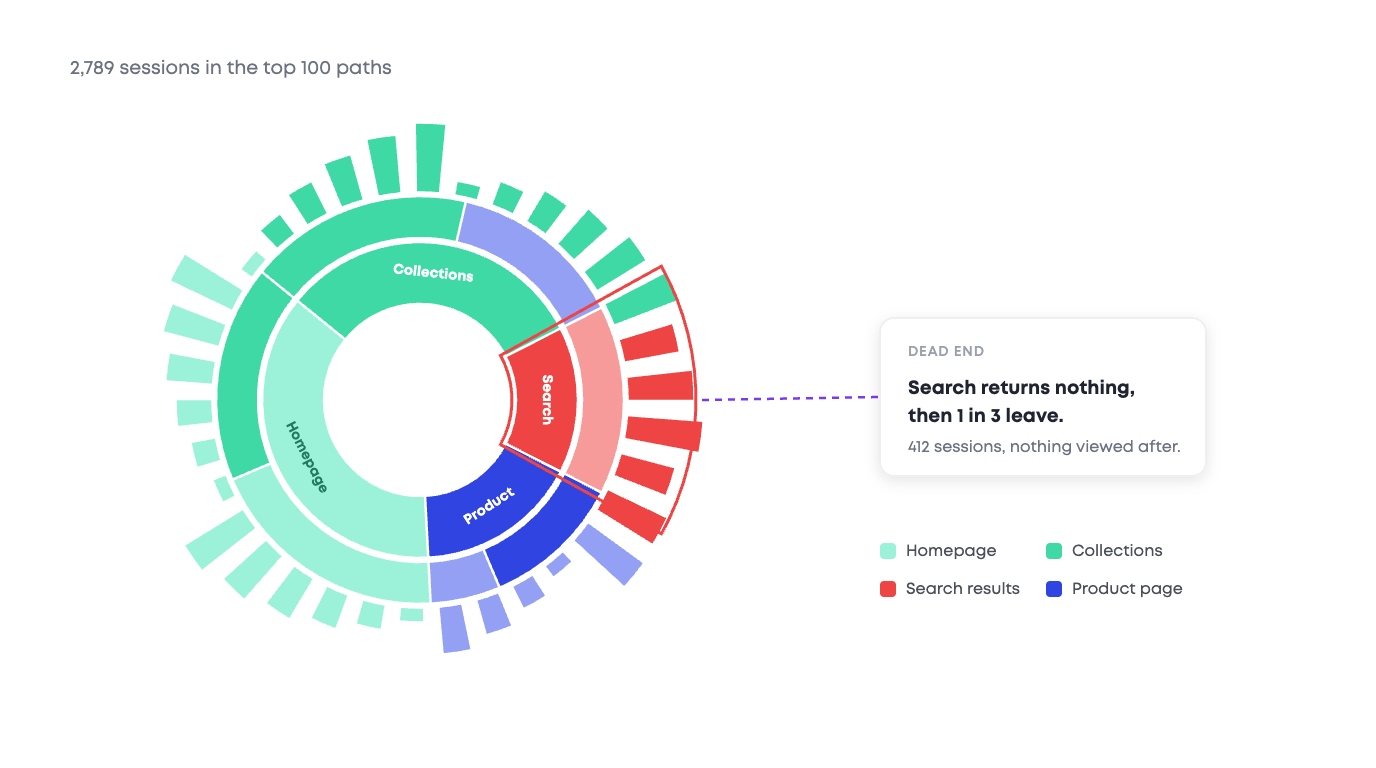
Digital Journey Map
Visualise the top navigation paths users take through your site and understand how different segments reach key events like checkout.
- Discover top navigation paths with segmentation
- See where drop-off users go before leaving
- Group pages into product or collection categories
Session Replay
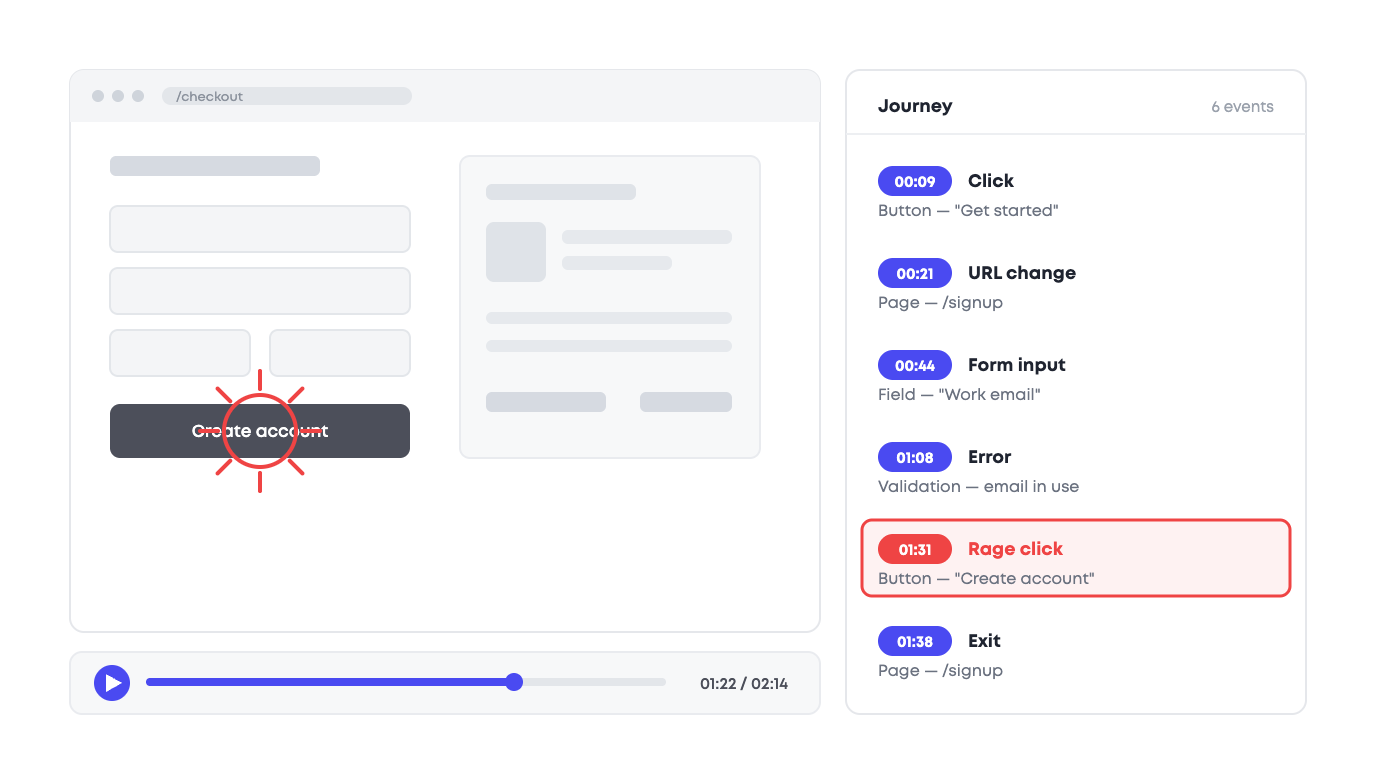
Watch pixel-perfect recordings of real user sessions to understand exactly what happened and why users struggled or converted.
- Pixel-perfect playback of user sessions
- Jump to key moments like errors or rage clicks
- Share replay links with your team instantly
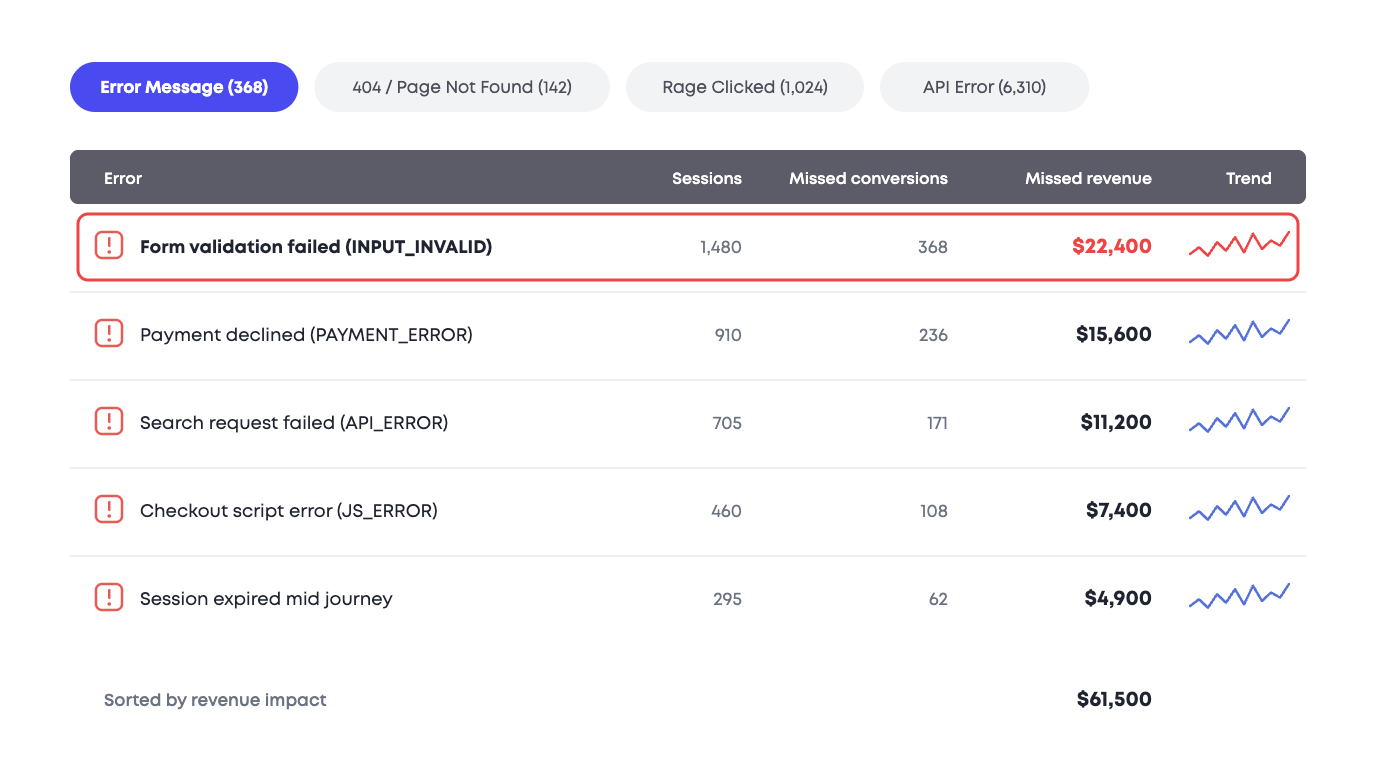
Error Impact Analytics
Detect errors, rage clicks, dead clicks, JS errors, and API failures — and quantify their real impact on conversions and revenue so you can prioritise fixes that matter most.
- See revenue lost to each error type
- Prioritise fixes by business impact
- Watch replays to diagnose root causes
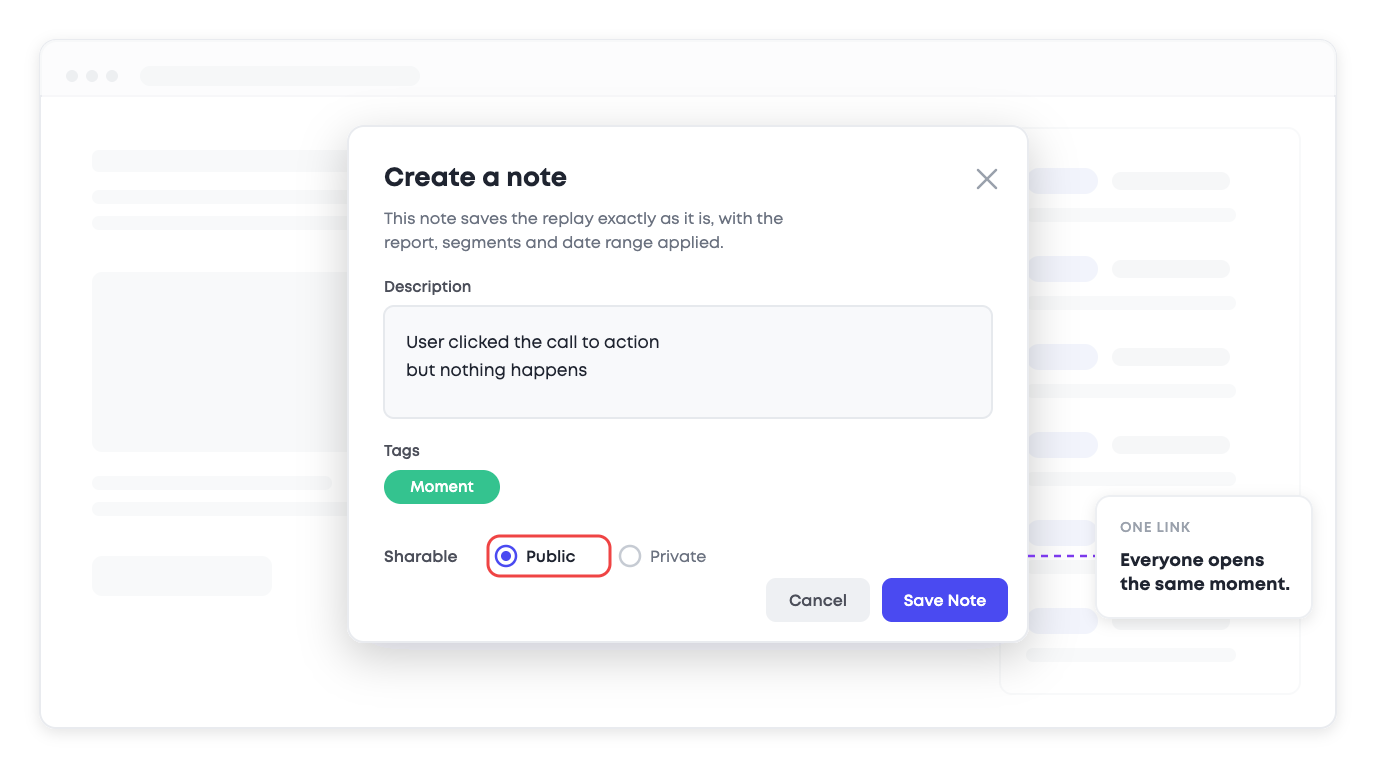
Share Insights
Easily share dashboards, session replays, and insights with your team using simple links — get everyone aligned without digging through data.
- Share replays and dashboards with one click
- Invite unlimited team members at no extra cost
- Get everyone aligned on what needs fixing
See Insightech in Action
Get a personalised demo and discover how Insightech can help you turn digital experience into revenue.
Book a DemoBuilt for Every Team
Make data part of every team's workflow
Intuitive Interface
Point-and-click analysis that anyone can use, no technical expertise required
Instant Sharing
Share dashboards, replays, and insights with simple links across your organisation
Unlimited Seats
Encourage company-wide adoption with no per-seat pricing barriers
Revenue Impact
Understand the real business impact of UX issues to prioritise fixes effectively
How Red Balloon Uses Experience Analytics to Drive Business Growth
CRO and website optimisation can be interchangeable but you always have a bigger list than you can deliver on. Insightech helps us ensure we spend the right time on the right things on that list!
"Every business I work in has a challenge around self-service insights. It's been the enigma in BI for years. Tools such as Insightech are really at the forefront of being a true self-service platform."Read their story
Turn Experience Into Revenue Insights
Get crystal-clear visibility into user behaviour, friction, and errors — prevent revenue loss, optimise journeys, and grow with confidence.